
by Jeff Pastoor, Beef Technical Consultant
Most cattle feeders know that feeding cattle for longer days comes with added expenses. It is common for some feeders to hold cattle to wait for a better market or to hit a certain pounds or dollars per head goal. Sometimes holding cattle is forced upon us. For the past 12-15 months the supply of market-ready cattle has exceeded the capacity of packing plants due to labor shortages that were caused by COVID 19, so added days on feed have been unavoidable by the feeder.
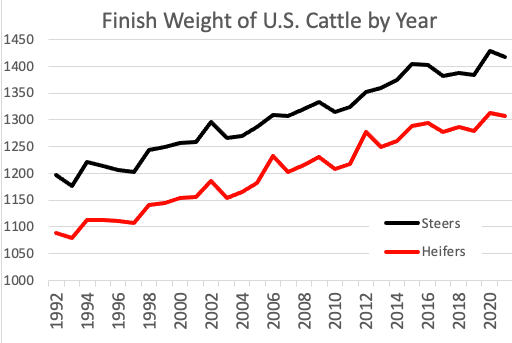
The challenge isn’t with heavier finish weights. Improvements in genetics and technology have allowed us to cost effectively feed cattle to larger weights than in the past. This chart shows the reported average finish weights (USDA) on steers and heifers since 1992.
But there are added expenses by feeding for longer days. This article will attempt to put some hard numbers on these added expenses.
Higher Cost Factors
There are two primary reasons why the cost of gain increases when the days on feed are extended.
1. Maturity – as cattle mature, they begin to convert more of what they eat into fat tissue than into muscle tissue. It takes far more feed to gain a pound of fat than it does to gain a pound of muscle.
2. Implants – when the days on feed are extended, we typically will go past the recommended days that an implant is active. When the implants have run out the cattle will be far less efficient in converting feed into gain.
Other factors that effect performance when days on feed are extended are the starting weight of the cattle, the sex of the cattle, the flesh condition of the cattle when they arrive, and the genetics of the cattle.
When we dig deeper into cattle closeouts, we can document that when cattle are on feed for longer days performance suffers.
Closeout Data
These next 4 charts show the trendlines from actual closeouts from the last 5 years. The trendlines represent a “moving average” of the actual daily gains and feed conversions (payweight to payweight) from each closeout. The closeouts were sorted by starting weight, so 5s, 6s, 7s, etc refer to the starting weight categories of the cattle.
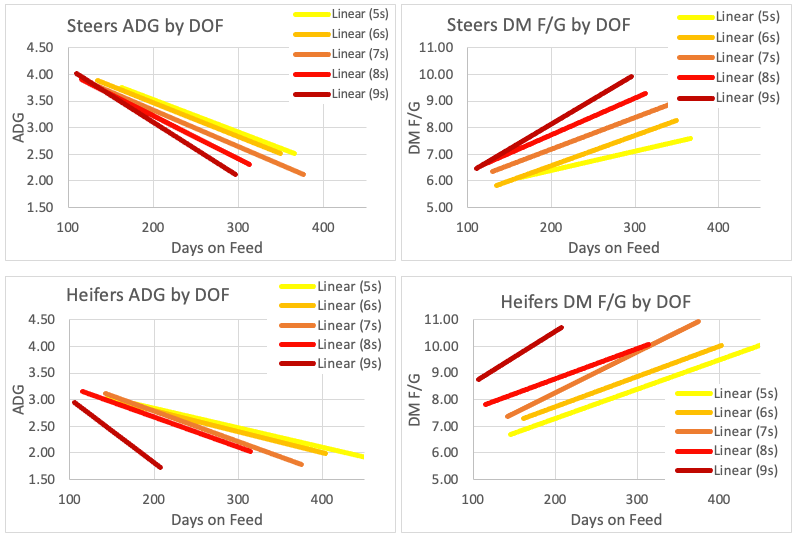
We can make some general observations from these charts:
- In each weight category, for both the steers and the heifers, as days on feed increase the average daily gain declines and the feed required per pound of gain increases. Not only do we know that performance declines, but we can calculate how much it declines from this data.
- The larger the cattle are when they start on feed, the more performance is reduced by added days on feed.
- In comparing the steers and heifers, it appears that for heifers added days has less of an effect on gain – the slope of the trend line is less steep in most of the weight categories, perhaps because heifer daily gains are already poorer than steers.
- But in most of the heifer categories added days on feed has a larger impact on feed conversions than it did on steers, as the trend lines are a little steeper.
The trend line allows us to derive a calculation that tells us how the number of days on feed effects the daily gain and feed conversion – from this we can then calculate how the daily gains and feed conversions change in 10-day increments. This gives us a better idea of the true effect of the added days on feed.
The next 4 charts show how the daily gain and feed conversion changes in 10-day increments, as cattle are on feed for more days.
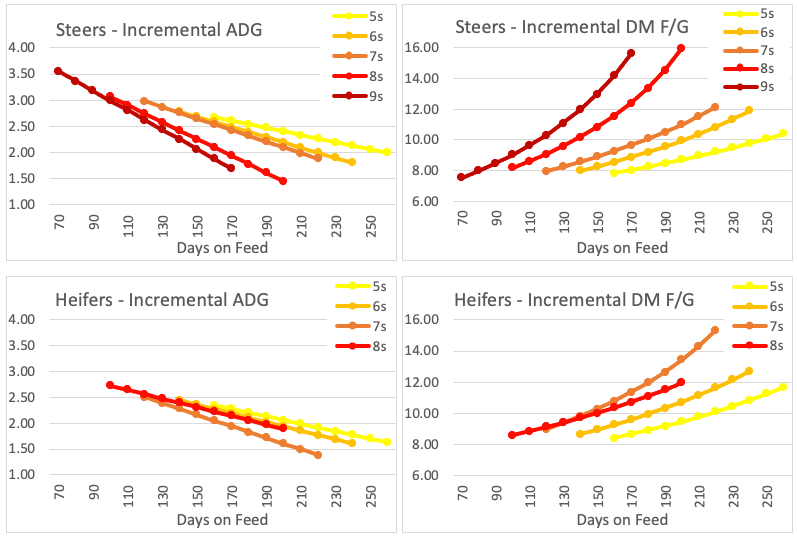
From these charts we can see that:
- The negative effects of longer days on feed effects yearlings more than calf-fed cattle.
- The steepness of the lines tells us feed conversions seem to be affected even more than daily gain by the additional days on feed.
- The curve on the DM F/G charts tells us the feed conversions get worse at an accelerated rate with more days on feed.
- It appears that steers drop off in performance more than heifers, but we need to remember the steers are starting with a higher daily gain and a lower feed/gain number.
- The 8 weight heifers are something of an outlier. I have noticed this before when doing similar analysis with closeout data in past years – the 8 weight heifers appear to be effected less by longer days on feed compared to the 7 weight heifers with the same number of days on feed.
These charts demonstrate the performance effects of the added days on feed, but this still doesn’t answer the question of what are the added costs of these added days.
Costs of Gain
By having the calculated daily gains and feed conversions for those 10-day periods we can then apply the assumed feed and non-feed costs and calculate the costs of gain.
These two charts show how the calculated cost of gain changes during those same 10-day periods for both steers and heifers at different starting weights. For these costs of gains $5.50/bu corn price and 50¢ per head per day for yardage + interest were assumed.
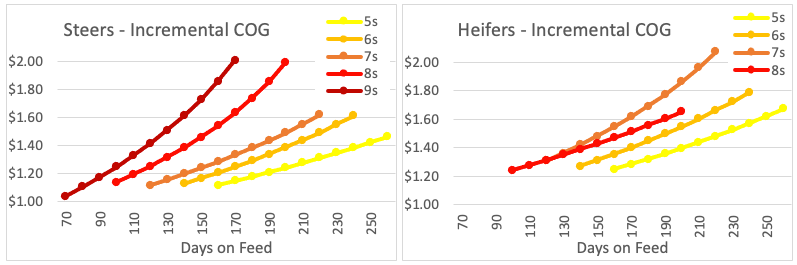
Here are some key points from these two charts:
- The patterns on the cost of gain are very similar to the patterns on the DM F/G. Feed conversion has long been considered the performance measurement with the greatest economic impact and these charts dovetail with that idea.
- Also similar to the feed conversions, the cost of gain on calf-fed cattle is affected less by the longer days on feed than with yearling cattle.
- For this range of days, the steers quite quickly get above $1.20 cost per pound of gain and the heifers all start over $1.20 per pound of gain. This is the effect of $5+ corn. It raises the cost of gain for the entire feeding period, but it has an even greater effect for the last days on feed.
By knowing the incremental cost of gain, and the current cattle market, we can then forecast the changes in profitability over a range of days.
Incremental Changes to Profits
These next two charts show the changes in the potential profit (not the profit per head) in 10-day increments for each of the weight categories for steers and for heifers at a $125 live cattle market:
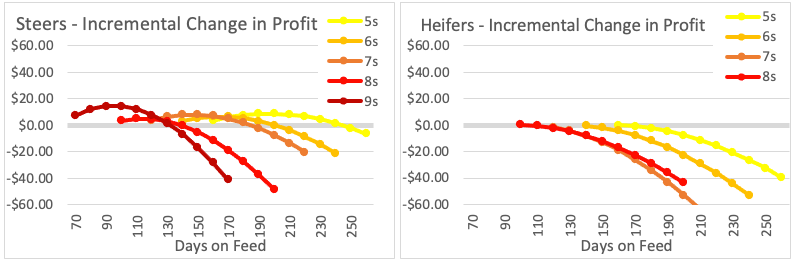
Looking at the markets for next winter and spring, here are the same charts, with the same costs of gain, run at a $135 live cattle market:
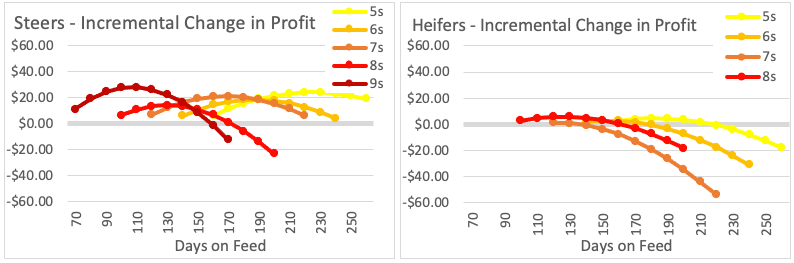
From these charts we can see:
- Just like with the cost of gain, these charts show that it is more costly to feed heifers for extra days than steers.
- Calf fed cattle can hold their profitability for a longer span of days better than yearlings.
- The peak area of the curve indicates a target for marketing the cattle – if the packer is willing to take them at the time.
- A $10 move (up or down) in the cattle market will shift the peak area by 20-30 days (up or down).
- Any change in the corn price and the live cattle market will change the shapes and shift the target areas of these incremental profit curves.
As mentioned before, these are the expected average results derived from a total closeout database. Individual groups will vary based on their genetics, flesh condition on arrival, their rations and how they are delivered. But we can still get a general idea of a target marketing strategy by using these calculations.
Holding Cattle
What if you have cattle that are ready for market but you make the decision to hold them longer because you expect the cattle market to improve – how much of a gain in the market do you need to offset the cost of added days? We can calculate from these curves that you would need to gain at least $2/cwt in the market every 10 days in order to hold profitability steady, and a larger gain than that to actually improve the profits on those cattle.
When considering holding cattle for a better market, consider that the market will either:
- Go up
- Hold steady
- Go down
If there is an equal chance of each to happen, you only have a 1 out of 3 chance that holding cattle will pay you more. Add on top of that you will need that market to not only move up, but it has to move greater than $2/cwt in 10 days just to break even. In general, it is best to sell the cattle when the cattle are ready to go.
Selling Dressed Cattle
All of this discussion has been based on selling live cattle (which is a majority of the cattle sold). If you are selling cattle in the meat, you can cost effectively feed them for more days.
Consider these points about selling dressed cattle:
- While the average daily gain of body weight declines with added days on feed, the carcass weight gain holds fairly steady. This is one of the reasons why the dressing percent improves as cattle have more days on feed.
- In general, you can increase the target days on feed for the cattle by 40-60 days longer when selling dressed.
- Even if you are normally a live seller, if you are forced to feed cattle longer days it would be wise to see if you could sell those longer day cattle on a dressed basis.
- If selling dressed because you are selling into a grid, you can almost always increase the premiums on Choice, CAB, and Prime grading cattle by feeding more days.
- There are also risks of feeding more days when selling into a grid
- You will increase the risk of Yield Grade 4 discounts. The other reason dressing percent improves with longer days on feed is fat deposition – fat does not shrink like muscle tissue.
- You can also increase the risk of heavy weight carcass discounts.
- These two discounts can easily wipe out the gains you make on quality grade.
Summary
The ideal days on feed for cattle is a moving target, depending largely on feed costs and the live cattle market but also influenced by cattle quality and management. Your consultant should be able to help you with analysis of all of these areas. QLF can help you improve your cost of gain for the entire time your cattle are on feed, by improved nutrition and ration condition, and by reducing sorting in the bunk.